Training Data
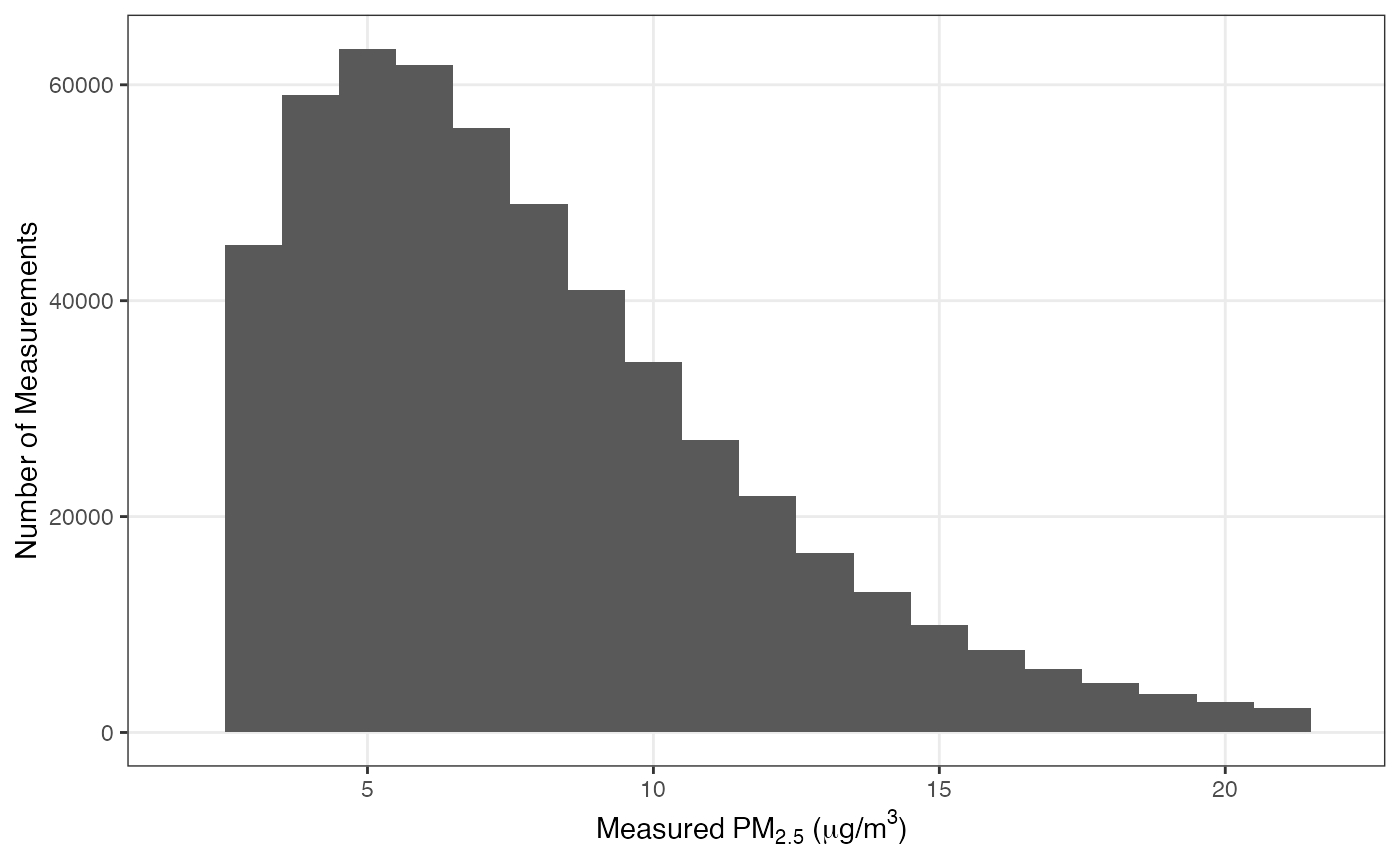
Training data consisted of 575,301 daily average PM\(_{2.5}\) concentrations from 778 EPA AQS monitors on 3,226 days between 2017-01-01 and 2025-10-31.
Overall, the median measured PM\(_{2.5}\) was 7 \(\mu g/ m^3\) and 99.5% of all measurements were between 1.8 and 21.8 \(\mu g/ m^3\):
Model Training
The EPA AQS monitor concentrations were used to train a generalized regression forest with 200 trees, a subsample fraction of 0.5, a minimum node size of 5, and an \(m_{try}\) value of 20.
Model predictors listed in the table below are ordered according to their importance. Here, the variable importance is calculated as an exponentially-weighted sum of how many times each feature was selected within the first 6 splits of each tree in the forest.
| importance | predictor |
|---|---|
| 0.74 | merra_oc |
| 0.09 | merra_bc |
| 0.06 | hpbl |
| 0.03 | plume_smoke |
| 0.02 | x, temperature_max |
| 0.01 | merra_so4 |
| 0.00 | y, doy, year, elevation_median, elevation_sd, temperature_min, precipitation, solar_radiation, wind_speed, wind_direction, specific_humidity, merra_dust, merra_ss |
Leave One Location Out (LOLO) Cross Validated Model Performance
Leave-one-location-out (LOLO) accuracy is calculated by using out of
bag predictions from the trained random forest with resample clustering
by the location. Accuracy is characterized using median absolute error
(mae) and the Spearman’s correlation coefficient
(rho). Accuracy metrics are calculated for each left out
location and then summarized using the median accuracy statistic across
all locations. This most closely captures the performance in a
real-world scenario where we are trying to predict air pollution between
2017 and 2025 in a place where it was not measured.
Each AQS monitor has a different number of measurements depending on
its measurement frequency and when it was deployed. To calculate LOLO
model performance, we exclude any station or station-time grouping that
has 4 or less observations. In the tables below, median_n
represents the median number of observations used in each station
grouping to calculate the overall median accuracy metrics.
ci_coverage is the percentage of the time that the 95% CI
interval of the predicted concentration contained the measured
concentration.

Monthly
Exclude stations with 4 or less total monthly observations.
| mae | rho | ci_coverage | median_n |
|---|---|---|---|
| 0.72 | 0.89 | 96% | 77 |
