Spatial Interpolation
interpolate.RmdSpatial interpolation is the process of transforming data from one
spatial resolution to another (e.g. from census tract to ZIP code). The
cincy::interpolate function uses census block-level weights
to interpolate data from one cincy geography to another
cincy geography. Variables prefixed with n_
will be interpolated extensively (weighted sum), and all other numeric
variables will be interpolated intensively (weighted mean).
Here, we interpolate fraction_poverty from the 2018
American Community Survey from 2010 census tracts to 2010 Neighborhoods
and 2010 ZCTAs.
library(cincy)
library(dplyr)
library(sf)
library(tmap)
library(tidyr)

d_tract <- st_transform(cincy::dep_index, 3735) |>
  select(census_tract_id_2010, fraction_poverty)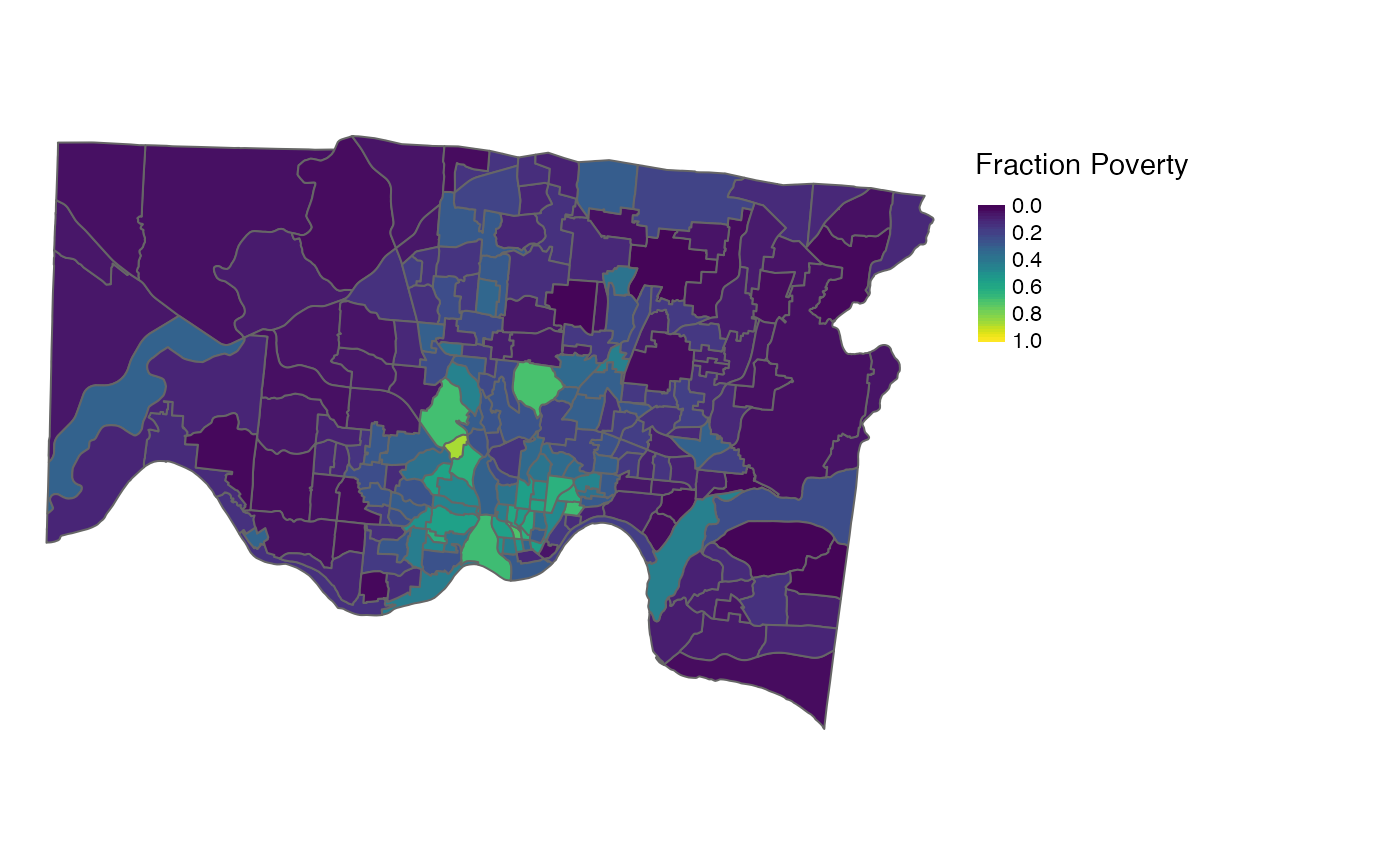
Interpolating to Neighborhood and ZCTA
The cincy::interpolate function allows the user to
choose from three sets of weights to be used for the weighted sums
and/or averages: block group population, block group
number of homes, and block group
area.
Neighborhood
d_neigh_pop <-
  d_tract |>
  cincy::interpolate(to = cincy::neigh_cchmc_2010, weights = "pop") |>
  st_transform(3735)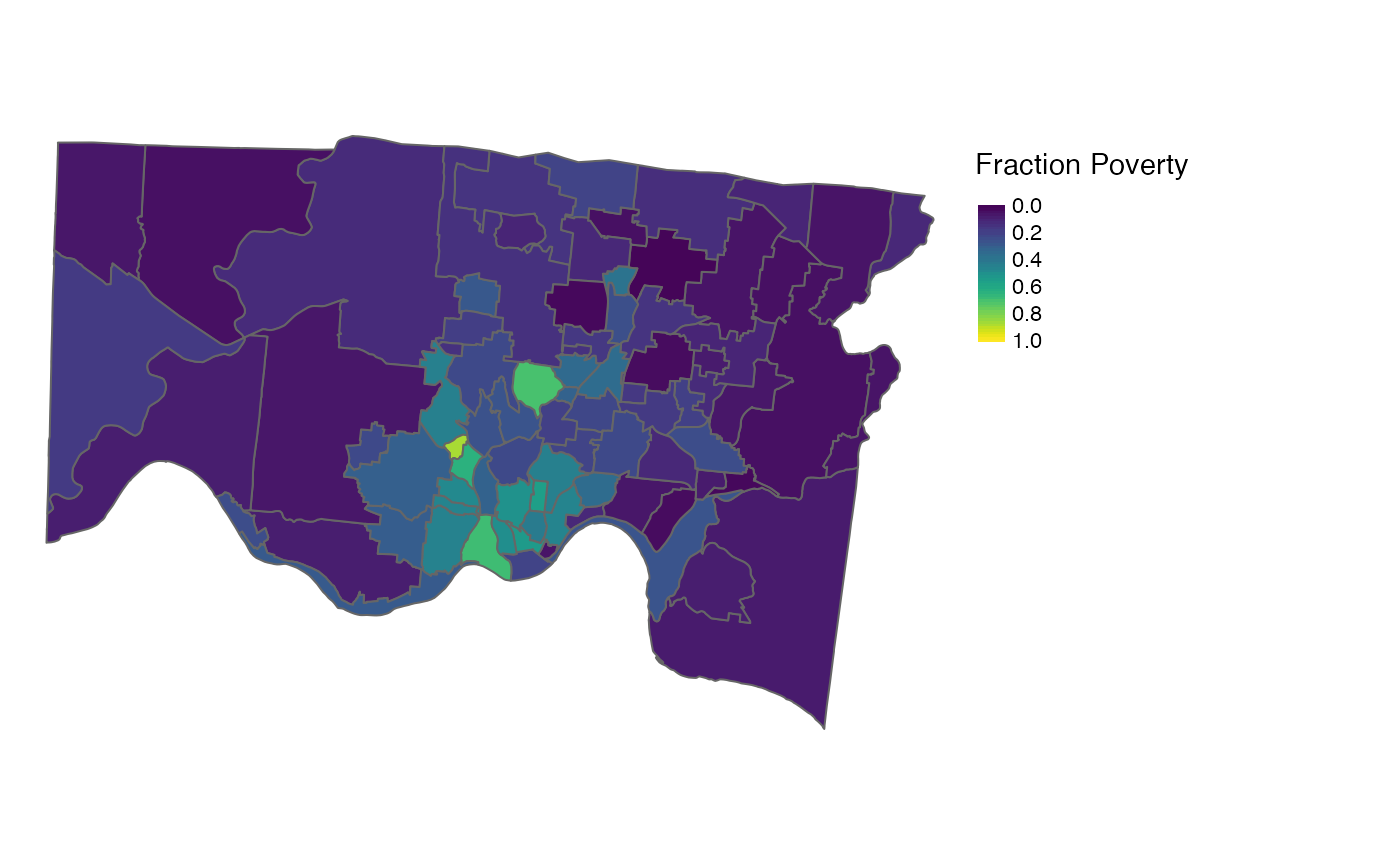
ZCTA
d_zcta_pop <-
  d_tract |>
  cincy::interpolate(to = cincy::zcta_tigris_2010, weights = "pop") |>
  st_transform(3735)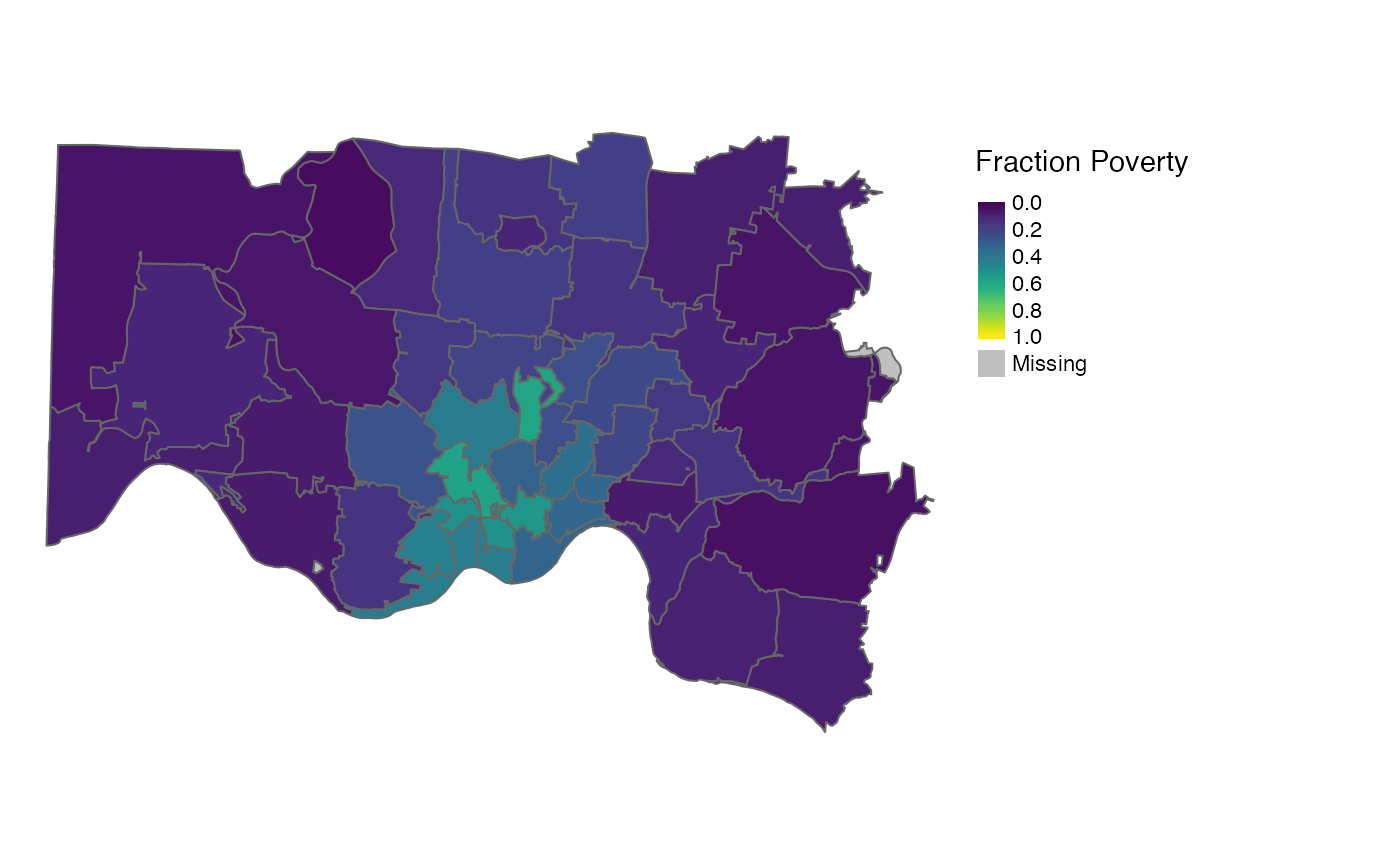
The above examples use population (pop) weights, but
homes or area weights can be used by changing
the weights argument.
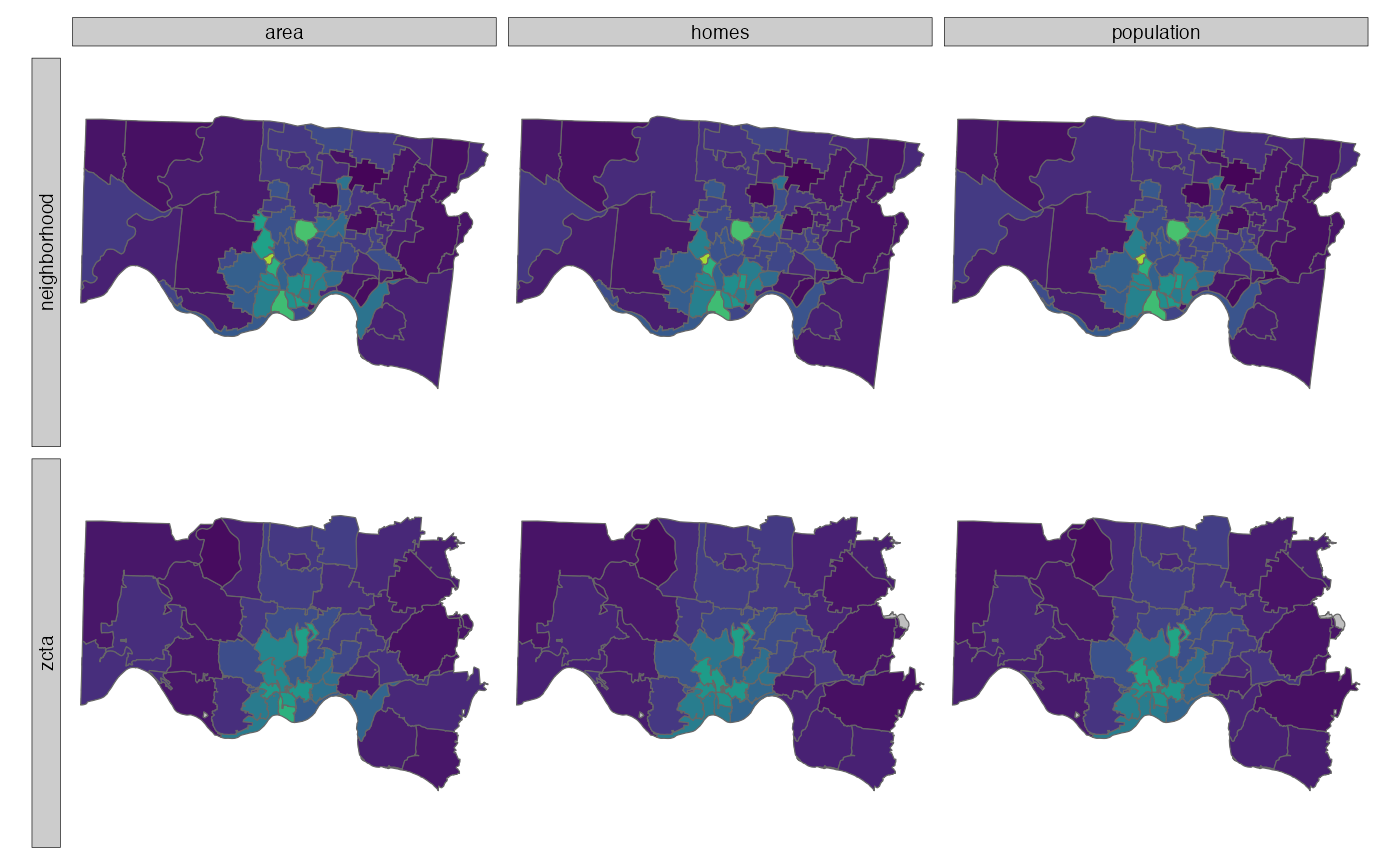
Note that we lose variability when interpolating from a smaller geography to a larger geography. This is especially noticeable when interpolating from tract to ZCTA.
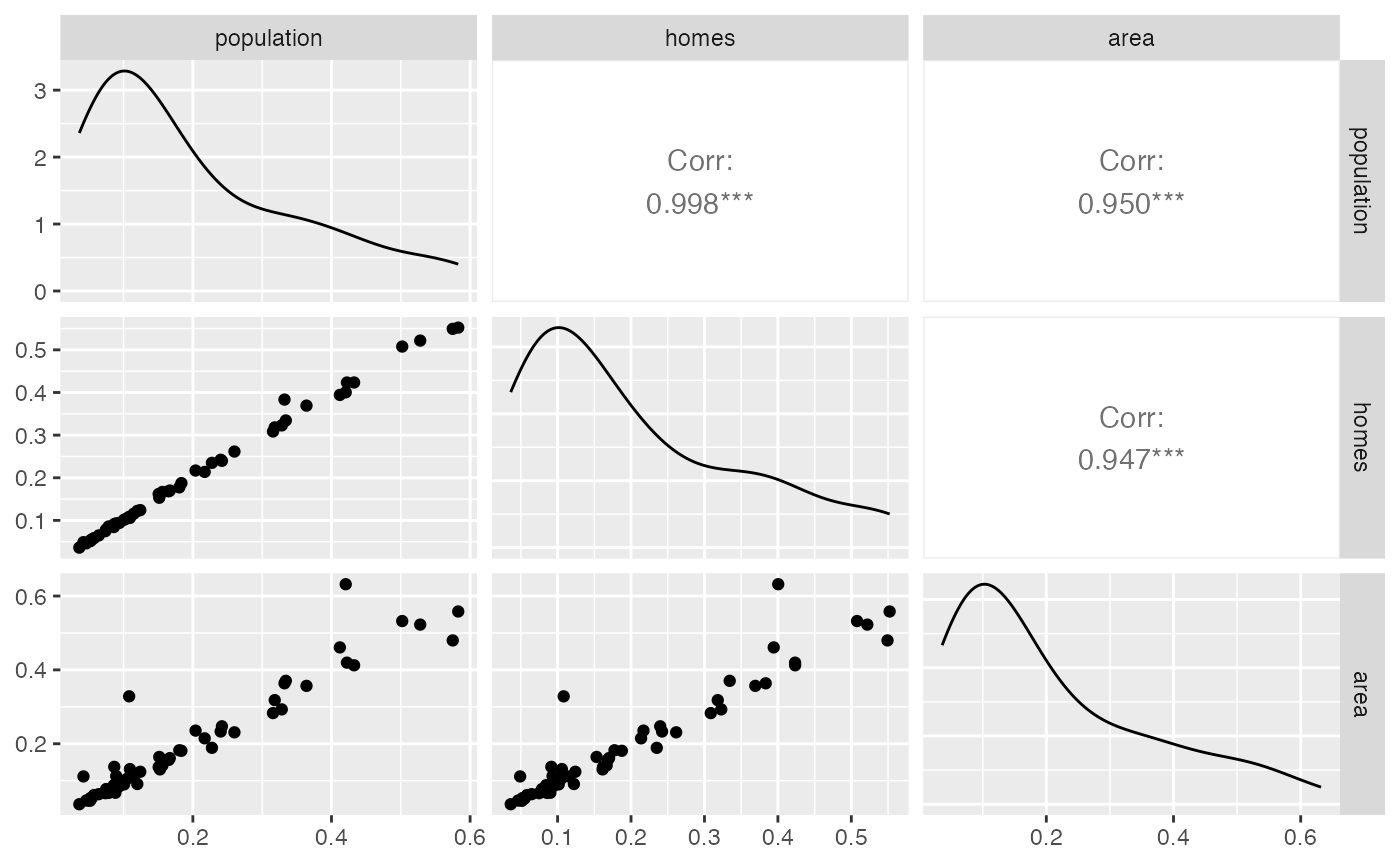
Also note that all three weights yield similar results in this
example. However, the result of using area weights varies
slightly compared to homes and population.
This conclusion is further supported by the correlation between
interpolated fraction_poverty values using the three sets
of weights.
Neighborhood fraction_poverty interpolated from
tract using population, homes, and
area weights

ZCTA fraction_poverty interpolated from tract
using population, homes, and area
weights